Fighting Crime
With Data

In 2018 has crime increased or reduced in Malaysia?
Are there subtle trends that reveal criminal behaviour?

By analysing historical index crimes in Malaysia this data story reports on local crime trends, hotspots and insights.

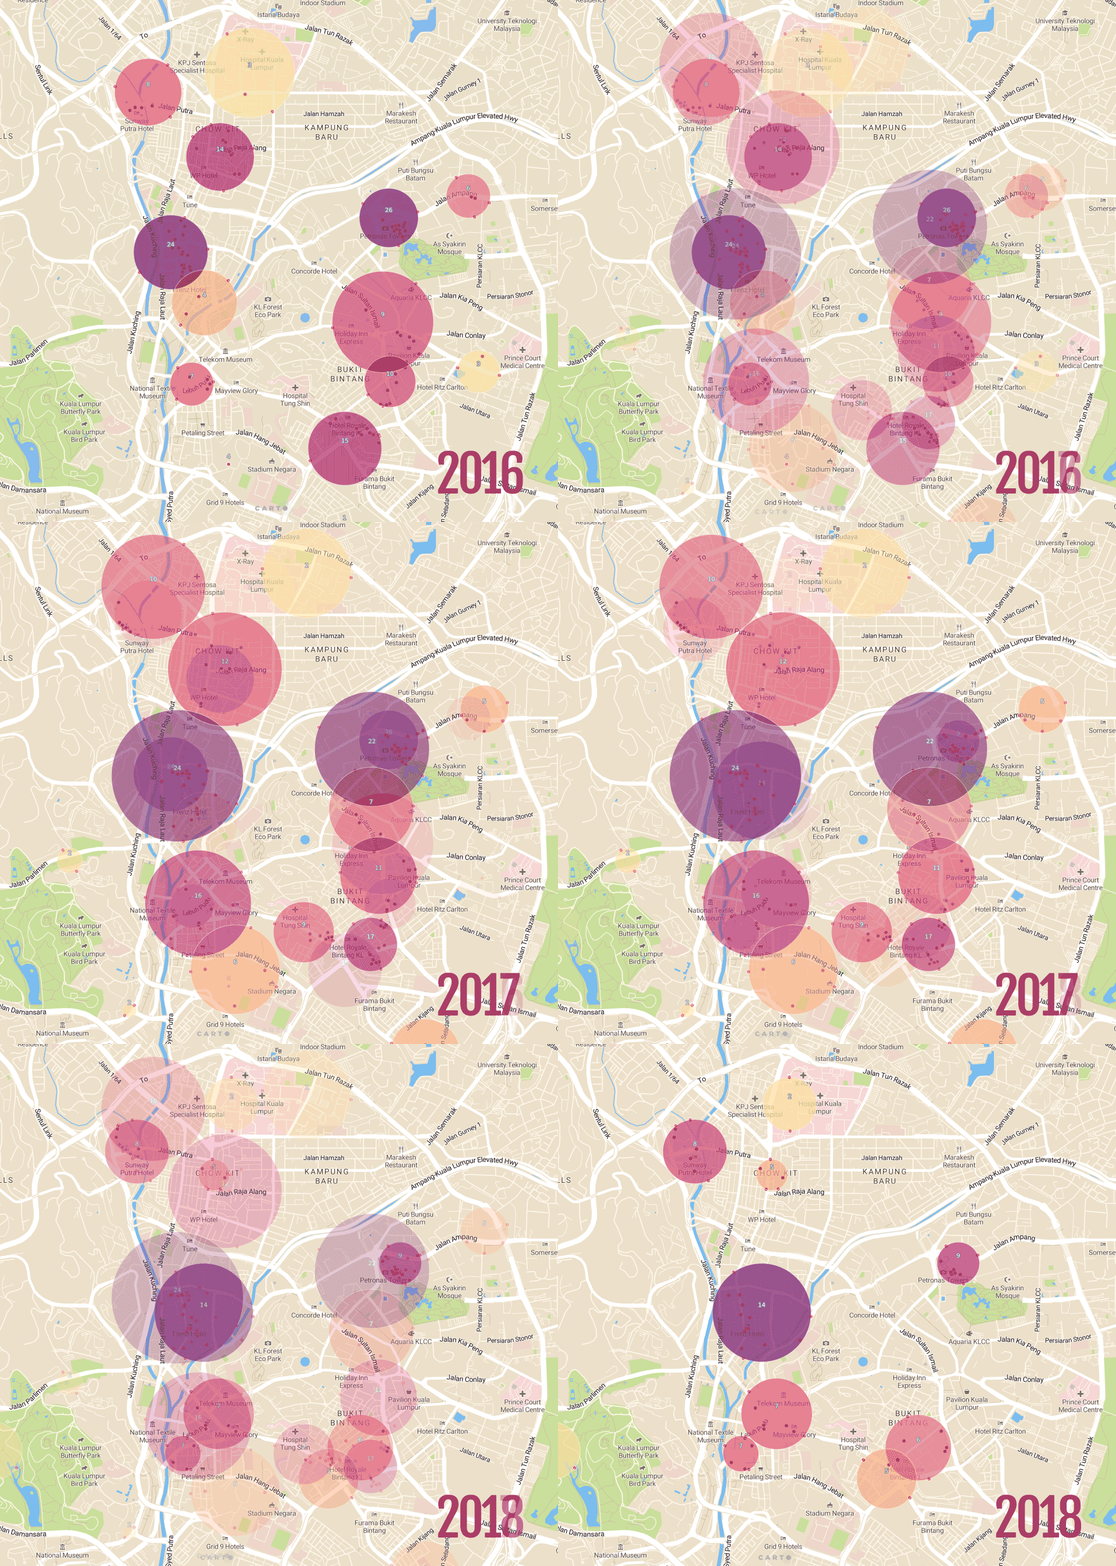
Time series snapshot of crime occurences from Oct 2017 to Oct 2018

Pickpocketing in tourist areas Image via Sagal News

High Pickpocketing and Robberies in KL Centre Tourist Locations

In Kuala Lumpur centre areas such as Jalan Dang Wangi, Jalan Bandar HS Lee and Chow Kit, pickpocketing and robberies without firearms are reported regularly. The figures show that these KL centre areas consistently rank at the top for recent years. Such areas are populated with many tourists and these crimes typically occur during the weekends when there are large crowds.

On a positive note, 2018 has seen a significant drop for these crime cases especially in KLCC and Bukit Bintang areas. In general, security in KL centre should be improved to create a positive tourism image for Kuala Lumpur and Malaysia.

Pickpocketing facts

Dang Wangi ranks

#1

for last 5 years. 67 cases in 2018

Dang Wangi has

56%

decrease from 2017-2018 (151 cases to 67 cases)

In most Dang Wangi areas - Jalan Bandar HS Lee & Jalan Dang Wangi, most cases occurred on

weekends (Sat & Sun)

(consistent from 2013 - 2018)

Robbery (without firearms) facts

Dang Wangi ranks

#1

in 2018 with 1215 cases, 2 times higher than..

Petaling Jaya ranks

#2

in 2018 with 574 cases

Dang Wangi ranks

top 2

for 5 years. 1st for 2017 & 2018

Crime Insight Questions

  • Are pickpocketing syndicates operating regularly in KL centre crowded areas?
  • Are victims mostly tourists or local residents?
  • Are pickpocketing and robbery without firearms crimes in KL centre areas correlate to peak tourist periods?

Quick crime facts in 2018

The highest Motorcycle Theft

6892

cases in Johor Bahru

The lowest Motorcycle Theft

178

cases in Perlis

The highest Burglary

3518

cases in Selangor

The lowest Burglary

38

cases in Perlis

The highest Violent Crime

196

rate in Kuala Lumpur

The lowest Violent Crime

29

rate in Sabah


How is crime classified?

Calculating crime is not simple. There are many categories and calculation methods that can be used. Before we dive into the statistics and analysis, it is important that we understand some key concepts.

What are Indexed Crimes?

Crime is always evolving so it is difficult to categorise and report. Because of this crimes are divided into two broad categories namely Indexed Crime and Non-Indexed Crime.


Indexed Crime is defined as “Crimes that are reported with sufficient regularity and with sufficient significance to be meaningful as an index to the crime situation.” (Inspector General’s Standing Order at para D203).

Non-Indexed crime*, however, are all other crimes that fall outside the scope of Indexed Crime.

Examples:

  • Kidnapping
  • Fraud
  • Vandalism
  • Prostitution etc.

Selected Index Crimes

For this data story we have chosen 8 main crime types for analysis.*


*The definitions here are descriptive and are not legal definitions

*Non-indexed crimes have been excluded

Burglary

Cases

15130

incidents in 2018

Rate

47

cases per 100,000 population

Burglary (sometimes referred to as Break-in) is the unlawful entry into a property or premise without the occupants present usually with a combined act of theft. This crime is often mis-labeled as robbery.

Fun Fact

Mouseover the cases to find the fun fact about this crime!

Robbery

Cases

11559

incidents in 2018

Rate

36.1

cases per 100,000 population

Robbery is the crime of taking anything of value with force. There are different types i.e. with a firearm, without a firearm etc. however for this data story we shall look at all types collectively under this one heading.

Fun Fact

Mouseover the cases to find the fun fact about this crime!

Other Theft

Cases

19230

incidents in 2018

Rate

61

cases per 100,000 population

Certain types of theft i.e. snatch theft, pickpocketing, have enough volume of cases to list as a category. Other theft refers to any type of theft that does not have a predefined category. This category is there to capture uncommon types of theft.

Fun Fact

Mouseover the cases to find the fun fact about this crime!

Harm to Humans

Cases

4657

incidents in 2018

Rate

15

cases per 100,000 population

Harm to humans is quite a broad category but essentially captures crimes that cause physical harm to a person.

Fun Fact

Mouseover the cases to find the fun fact about this crime!

Rape

Cases

1409

incidents in 2018

Rate

4.4

cases per 100,000 population

Rape is the crime of forcing a victim to engage in non-consensual sexual intercourse. In Malaysia, due to the legal definition, a man cannot be raped and only a man can carry out an act of rape.

Fun Fact

Mouseover the cases to find the fun fact about this crime!

Murder

Cases

341

incidents in 2018

Rate

1.06

cases per 100,000 population

Murder is an act of unlawful pre-meditated killing. This is a very serious offence and requires 2 key components; the intention to kill and the act of killing.

Fun Fact

Mouseover the cases to find the fun fact about this crime!

Motorcycle Theft

Cases

28125

incidents in 2018

Rate

88

cases per 100,000 population

Motorcycle theft is the criminal act of stealing of a motorcycle. This crime, when compared to all the other categories, has the highest number of cases recorded across the country.

Fun Fact

Mouseover the cases to find the fun fact about this crime!

Car, Van/Lorry Theft

Cases

9292

incidents in 2018

Rate

29

cases per 100,000 population

This is the criminal act of stealing a motorcar, van or lorry. This category does not differentiate between private and commercial owned vehicles.

Fun Fact

Mouseover the cases to find the fun fact about this crime!
How do these crime types rank by state?

Crime Analysis by State in 2018

Ranks nth for by Crime Rate

The rank between states for crime rates may differ from crime cases due to different population sizes of each state

Crime Hotspots

Select / Deselect all

Types of Crime

Top Crime Hotspots by Police Station

Top
182 cases

Car Theft in

Kota Bharu

District: Kota Bharu

Feature: Multiple Clusters

177 cases

Car Theft in

Kepong

District: Sentul

Feature: Multiple Clusters

Top
470 cases

Motorcycle Theft in

Sungai Petani

District: Kuala Muda

Feature: Evenly Distributed

445 cases

Motorcycle Theft in

Selayang

District: Gombak

Feature: Multiple Clusters

Top
276 cases

Burglary in

Klang

District: Klang

Feature: Central

255 cases

Burglary in

Sandakan

District: Sandakan

Feature: Evenly Distributed

Top
66 cases

Robbery in

Jln Bandar (H.S. Lee)

District: Dang Wangi

Feature: Central

44 cases

Robbery in

Jln Dang Wangi

District: Dang Wangi

Feature: Multiple Clusters

Top
106 cases

Harm to humans in

Jinjang

District: Sentul

Feature: Multiple Clusters

72 cases

Harm to humans in

Klang

District: Klang

Feature: Evenly Distributed